6
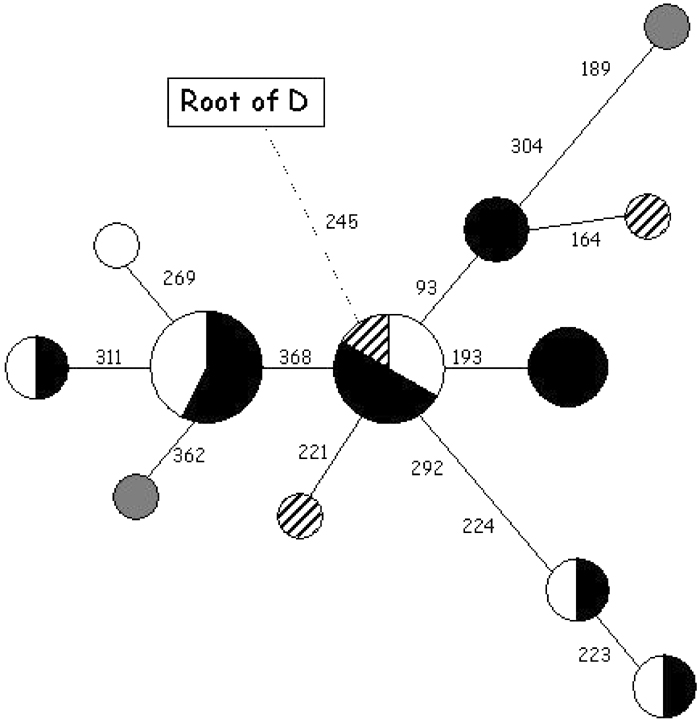
D3.js를 사용하여 D3 강제 지시 레이아웃 그래프의 노드에 원형 차트를 배치하고 싶습니다. 이것은 집단 유전학의 일반적인 시각화, 나는 아주 기본적인 그래프 플롯으로 시작했습니다 http://mathildasanthropologyblog.files.wordpress.com/2008/06/as3.jpgD3의 강제 지시 레이아웃 그래프 노드에 원형 차트 놓기

예를 들어 볼 수 있습니다 :
<!DOCTYPE html>
<html lang="en">
    <head>
     <script type="text/javascript" src="d3/d3.v3.js"></script>
    </head>
    <body>
     <script type="text/javascript">

graph = { "nodes":[{"proportions": [{"group": 1, "value": 1},
            {"group": 2, "value": 2},
            {"group": 3, "value": 3}]},
        {"proportions": [{"group": 1, "value": 2},
            {"group": 2, "value": 2},
            {"group": 3, "value": 2}]}],
      "links":[{"source": 0, "target": 1, "length": 500, "width": 1}]
     }

var width = 960,
    height = 500,
    radius = 10,
    color = d3.scale.category20c();

var svg = d3.select("body").append("svg")
    .attr("width", width)
    .attr("height", height);

var force = d3.layout.force()
    .charge(-120)
    .size([width, height]);

force
    .nodes(graph.nodes)
    .links(graph.links)
    .start();

var link = svg.selectAll(".link")
    .data(graph.links)
    .enter().append("line")
    .attr("class", "link");

var node = svg.selectAll(".node")
    .data(graph.nodes)
    .enter().append("circle")
    .attr("class", "node")
    .attr("r", radius)
    .call(force.drag);

force.on("tick", function() {
    link.attr("x1", function(d) { return d.source.x; })
     .attr("y1", function(d) { return d.source.y; })
     .attr("x2", function(d) { return d.target.x; })
     .attr("y2", function(d) { return d.target.y; });

    node.attr("cx", function(d) { return d.x; })
     .attr("cy", function(d) { return d.y; });
});
     </script>
    </body>
</html>
하지만 난과 원 노드를 교체 할 때 원형 차트, 원형 차트는 모두 음모의 모서리에 쌓여 있습니다.
<!DOCTYPE html>
<html lang="en">
    <head>
     <script type="text/javascript" src="d3/d3.v3.js"></script>
    </head>
    <body>
     <script type="text/javascript">

graph = { "nodes":[{"proportions": [{"group": 1, "value": 1},
            {"group": 2, "value": 2},
            {"group": 3, "value": 3}]},
        {"proportions": [{"group": 1, "value": 2},
            {"group": 2, "value": 2},
            {"group": 3, "value": 2}]}],
      "links":[{"source": 0, "target": 1, "length": 500, "width": 1}]
     }

var width = 960,
    height = 500,
    radius = 10,
    color = d3.scale.category20c();

var pie = d3.layout.pie()
    .sort(null)
    .value(function(d) { return d.value; });

var arc = d3.svg.arc()
    .outerRadius(radius)
    .innerRadius(0);

var svg = d3.select("body").append("svg")
    .attr("width", width)
    .attr("height", height);

var force = d3.layout.force()
    .charge(-120)
    .size([width, height]);

force
    .nodes(graph.nodes)
    .links(graph.links)
    .start();

var link = svg.selectAll(".link")
    .data(graph.links)
    .enter().append("line")
    .attr("class", "link");

var node = svg.selectAll(".node")
    .data(graph.nodes)
    .enter().append("g")
    .attr("class", "node");

node.selectAll("path")
    .data(function(d) {return pie(d.proportions); })
.enter().append("svg:path")
    .attr("d", arc)
    .style("fill", function(d) { return color(d.group); });;

force.on("tick", function() {
    link.attr("x1", function(d) { return d.source.x; })
     .attr("y1", function(d) { return d.source.y; })
     .attr("x2", function(d) { return d.target.x; })
     .attr("y2", function(d) { return d.target.y; });

    node.attr("x", function(d) { return d.x; })
     .attr("y", function(d) { return d.y; });
});
     </script>
    </body>
</html>
모든 도움을 주시면 감사하겠습니다.
node.attr("x", function(d) { return d.x; })
    .attr("y", function(d) { return d.y; });
SVG 경로가 그런 X/Y 속성이 없습니다 :
는
우수한. 고맙습니다! – Ryan